
The Achievement Gap is the difference in test scores between students from high income families and students from low income families. Sadly, many articles about the Achievement Gap falsely claim it is about racism – with black students performing less well than white students. In fact, black students from wealthy families or black students that have the benefit of attending schools with small class sizes perform as well as white students. So student achievement has nothing to do with the color of a child’s skin. It has everything to do with family income and lower class sizes.
One measure of lower family income is the percent of free and reduced price lunch in any given school or school district. This is called the FRPL Achievement Gap. As about half of all students qualify for free lunch, this compares the upper half of all students by income to the lower half. Other studies have found that the Achievement Gap is much higher when comparing students in the 80th or 90th percentile of income to the the 20th or 10th percentile of income.
Whatever measure is used, the Achievement Gap has existed for more than 70 years. During this 70 years, nearly all politicians have claimed that reducing or eliminating the Achievement Gap is one of their top priorities. Like Snake Oil Salesmen, they claim to have a Magic Bullet solution. In fact, only one study has actually resulted in eliminating it. This was the Tennessee STAR study done in the 1990s. This study reduced class sizes in Grades K through 3 so that low income struggling students could get the help they need to “catch up” to students from higher income families. This study found that years later, these lower income students test scores and graduation rates were nearly identical to the test scores and graduation rates of students from higher income families.
Sadly, in Washington state, since 2003, when we began to give away billions in tax breaks to wealthy corporations like Microsoft and Boeing, we have subjected our students to among the highest class sizes in the nation. We therefore have had, since 2003, one of the largest Achievement Gaps in the nation. In this report, we will take a closer look at the Achievement Gap in Washington state using recent national and state test results.
National Test Results
A 78 page study published in 2021 study used NAEP 8th grade math test scores from 2003 to 2017 to analyze Achievement Gap trends between the highest and lowest-income students. The data showed more of the poorest 20 percent of 8th graders in each state reached basic and proficient math achievement over that 14 year period. Here is a link to this study: https://www.air.org/sites/default/files/US-National-State-Trends-in-Educational-Inequality-Due-to-SES-2003-2017-March-2021.pdf
Here is the chart showing the gradual increase in 8th Grade Math test scores of low income students compared to the average and higher income students. SES stands for Social Economic Status which is the term used for Free and Reduced Price Lunch:
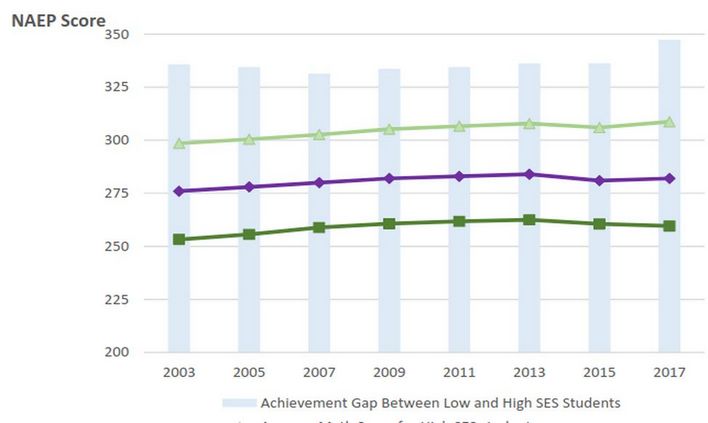
This chart shows that despite the gradual improvement of lower income students by 10 points, there has been an equal gradual increase of upper income students of 10 points. Thus, the actual achievement gap has remained at about 45 points despite the gradual income in scores.
Nationally, the percentage of low income students who achieved at or above the NAEP Basic level increased from 41 percent to 46 percent and the percentage who achieved at or above the NAEP Proficient level increased from 8 percent to 12 percent. Nine states managed to reduce the Achievement Gap from 2003 to 2017:
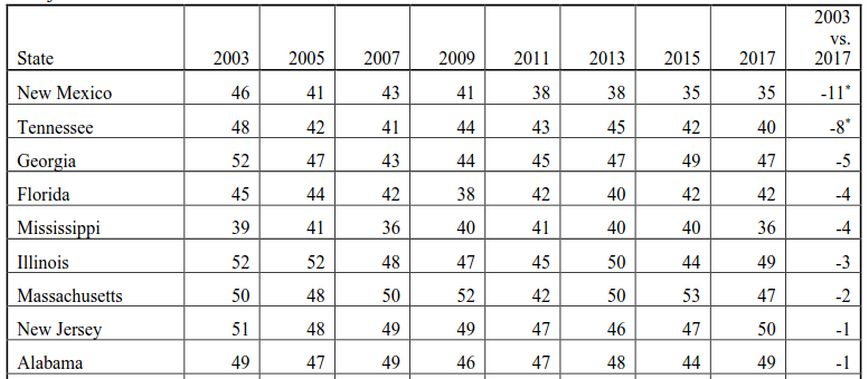
Note that both New Jersey and Massachusetts increased funding and lowered class sizes for low income students. Sadly 14 states saw widening achievement gaps between high- and low- income students. The Achievement Gap in Washington state increased from 2003 to 2017 by 7 points.
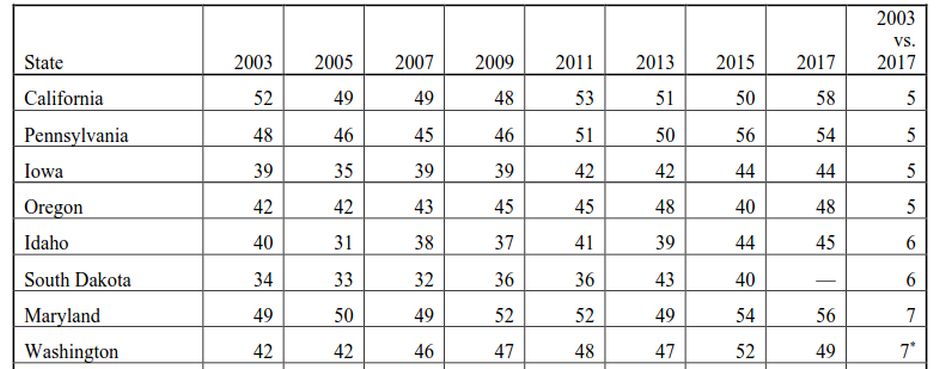
Note that the gap between higher and lower income Washington students grew from 42 points to 49 points. Thus Washington state has been one of the worst states in the nation during the past 20 years when it comes to reducing the Achievement Gap.
Nationally, there was a slight increase in the percent of low income students who had test scores at or above the NAEP Basic level, from 41% in 2003 to 46 percent in 2017, an increase of 5%. Many states saw increases of more than 10%:
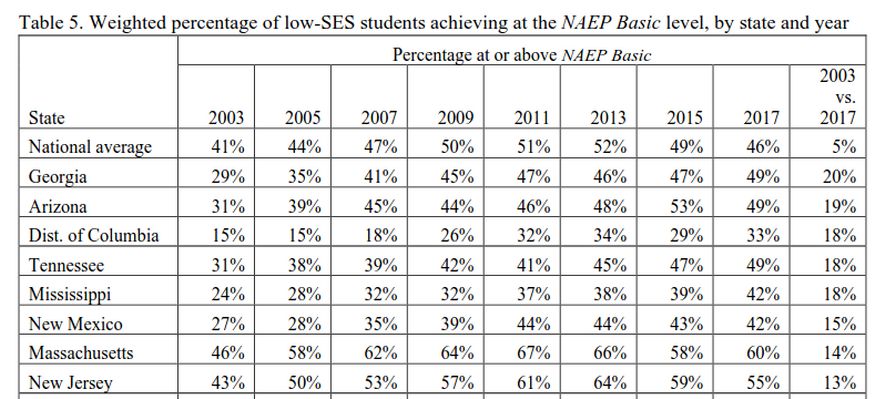
However, Washington state low income students who scored at the Basic Level only gained 4% from 49% in 2003 to 53% in 2017.
How can Washington State be near the highest in the nation in state income but near the lowest in reducing the Achievement Gap?
There are different explanations for how different states were able to reduce the Achievement Gap. For example, some states like Georgia, Arizona, Tennessee, Mississippi and New Mexico started out with very low percentages of low income students who were able to pass the 8th Grade Math test. So their huge improvements merely brought them closer to the national average.
Washington is also a relatively wealthy state. Different studies rank Washington differently when in comes to State income. One study claimed Washington state was third in the nation in per capita income:
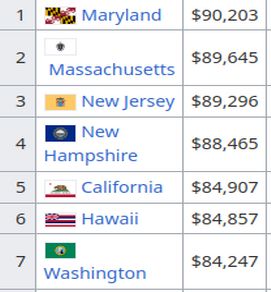
Another study concluded that, excluding the District of Columbia, Washington was sixth in the nation in per capita income.
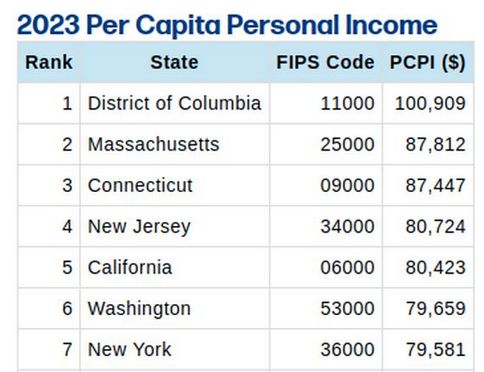
Another student concluded that Washington was seventh in the nation in per capita income:
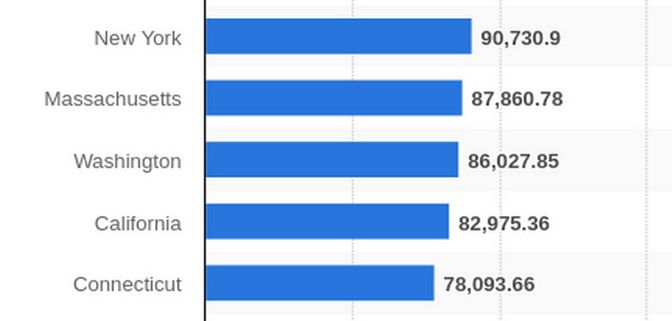
It therefore is a major disgrace that Washington has not been able to reduce the Achievement Gap like Massachusetts and New Jersey. Here is school funding in Washington state over time as a percent of income:
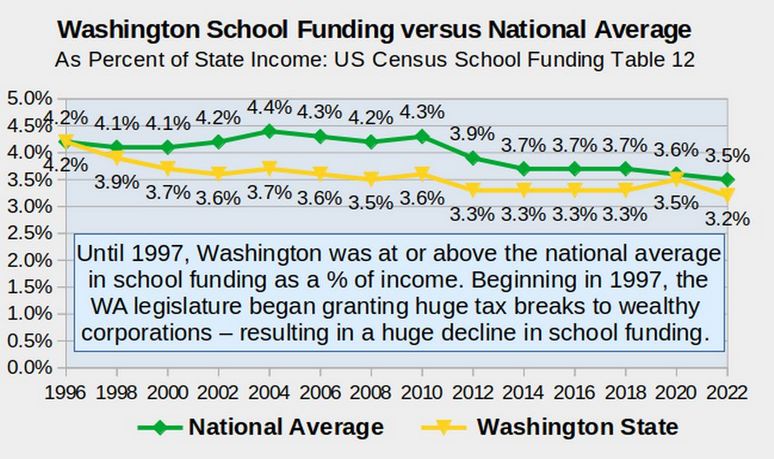
As of 2022, Washington spent 3.2 percent of income on school funding while Massachusetts spent 3.5% and New Jersey spent over 4%. New York was the highest at 5%. In would take an increase of 10% or about $2 billion in additional funding per year to get to the national average and to the average spent by Massachusetts. This should result in National average school funding in our state for the first time since 1996. But to actually help reduce the Achievement Gaps, these funds would need to be directed towards increasing class sizes in schools and school districts that have the highest poverty rates.
Later in this report, we will show a table of school districts ranked by Free Lunch percent. We show that these high poverty school districts also have very low test scores on the 8th Grade Math test. The question is whether our state leaders have the political courage to actually address this problem by advocating for funding closer to the national average and then actually directing this additional funding to the schools and school districts with the biggest problems. It seems what we really do is increase the problem by having a few very wealthy school districts that can pass local levies - and then a bunch of very poor school districts that can not pass local levies.
Increase in the Washington state Achievement Gap since Reykdal took over in 2017
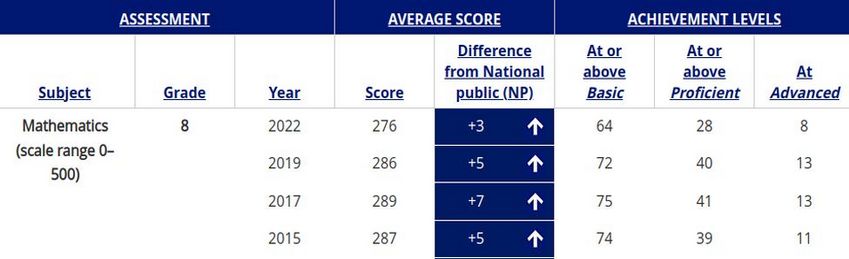
Here is a link to the NAEP test results page for Washington: https://www.nationsreportcard.gov/profiles/stateprofile/overview/WA?chort=1&sub=MAT&st=MN&year=2022R3&sfj=NP&cti=PgTab_OT&sj=WA
The 2022 NAEP Eighth Grade Math score is disastrous. When Reykdal took office in 2017, Washington Eighth Graders were among the highest in the nation at 7 points above the national average and 41% proficient. Now, our Eighth graders are only 3 points above the national average and only 28% proficient. Clearly our students are going in the wrong direction.
Click on Student Groups and Gaps. Then select National School Lunch. Then select the 8th grade math test. Here are the results since 2017:
|
Year |
National Rank |
Low Income |
Not Low Income |
Difference |
National Ave Difference |
|
2017 |
36 |
272 |
301 |
29 |
30 |
|
2019 |
42 |
268 |
302 |
34 |
30 |
|
2022 |
42 |
260 |
290 |
30 |
27 |
While the national gap has dropped slightly from 30 points to 27 points, the Washington state gap increased from 29 points to 30 points.
Note that this result is slightly different than reported in the 2021 study above – which had a Washington state gap of 49 points. The difference is that the NAEP website is only comparing free lunch to non-free lunch test scores. Since about half the students are free lunch, the NAEP gap is the gap between the upper half of students incomes and the lower half of student incomes. The 2021 study was comparing the gap between the upper 20% of all student incomes and the lower 20% of all student incomes which is why the 2021 study found a larger gap in test scores.
Washington State 8th grade math test score gaps
We will now look at the achievement gap in terms of Washington State 8th grade test score gaps. Here is a table of Washington school districts ranked by their percent of free lunch. Note that the higher the percent of free lunch, the lower the percent of students passing the 8th grade math test. Also note the huge decline from 2019 to 2023:
|
School District |
Enroll 2022 - 23 |
Chronic Absence CA % |
% Free Lunch |
8th grade math spring |
8th grade math spring |
|
Mercer Is |
3982 |
10 |
5 |
81 |
71 |
|
Bainbridge Is |
3505 |
23 |
9 |
78 |
67 |
|
Lake WA |
30591 |
21 |
10 |
76 |
68 |
|
Snoqualmie V |
7010 |
20 |
12 |
69 |
51 |
|
Issaquah |
19225 |
19 |
12 |
76 |
68 |
|
Riverview |
3060 |
25 |
15 |
60 |
44 |
|
Camas |
7119 |
18 |
16 |
74 |
63 |
|
Northshore |
22378 |
20 |
16 |
64 |
50 |
|
Tahoma |
8823 |
22 |
18 |
61 |
50 |
|
Peninsula |
8858 |
23 |
21 |
63 |
46 |
|
Snohomish |
9255 |
28 |
21 |
54 |
46 |
|
Bellevue |
18651 |
15 |
21 |
71 |
60 |
|
Ridgefield |
3877 |
32 |
25 |
53 |
39 |
|
Steilacoom |
3070 |
23 |
28 |
53 |
24 |
|
Enumclaw |
4253 |
26 |
29 |
58 |
37 |
|
Shoreline |
9142 |
24 |
29 |
63 |
47 |
|
Lake Stevens |
9353 |
27 |
29 |
51 |
34 |
|
Sumner |
10148 |
30 |
29 |
61 |
49 |
|
Stanwood Camano |
4705 |
30 |
30 |
56 |
30 |
|
Seattle |
50336 |
25 |
30 |
61 |
48 |
|
Orting |
2699 |
35 |
31 |
36 |
26 |
|
Mead |
10218 |
17 |
31 |
64 |
42 |
|
Anacortes |
2523 |
24 |
32 |
67 |
49 |
|
White River |
4211 |
27 |
32 |
46 |
34 |
|
Olympia |
9473 |
24 |
32 |
69 |
43 |
|
Monroe |
5494 |
31 |
33 |
50 |
33 |
|
Tumwater |
6681 |
29 |
33 |
51 |
35 |
|
Bellingham |
11316 |
35 |
33 |
46 |
40 |
|
North Kitsap |
5295 |
30 |
35 |
49 |
40 |
|
Pullman |
2687 |
25 |
36 |
57 |
54 |
|
Battleground |
12155 |
27 |
37 |
46 |
32 |
|
Washougal |
2802 |
36 |
38 |
53 |
33 |
|
Arlington |
5420 |
29 |
38 |
37 |
25 |
|
Edmonds |
19926 |
29 |
38 |
49 |
31 |
|
Central Kitsap |
10941 |
28 |
39 |
56 |
31 |
|
Everett |
19761 |
30 |
39 |
56 |
47 |
|
Univ Place |
5511 |
22 |
40 |
64 |
42 |
|
South Kitsap |
8975 |
30 |
40 |
40 |
34 |
|
Lynden |
3440 |
19 |
41 |
47 |
31 |
|
Oak Harbor |
5513 |
26 |
41 |
41 |
31 |
|
Richland |
13641 |
25 |
41 |
45 |
34 |
|
Ellensburg |
3203 |
26 |
42 |
48 |
31 |
|
Central Valley |
14119 |
31 |
42 |
51 |
40 |
|
Puyallup |
22869 |
33 |
42 |
46 |
27 |
|
Lakewood |
2535 |
41 |
44 |
37 |
17 |
|
North Thurston |
14809 |
35 |
44 |
46 |
28 |
|
STATE |
1.07M |
30 |
44 |
46 |
32 |
|
Yelm |
5565 |
29 |
46 |
50 |
40 |
|
Fife |
3854 |
27 |
48 |
29 |
23 |
|
Mukilteo |
15190 |
28 |
48 |
48 |
33 |
|
Chehalis |
2869 |
30 |
49 |
50 |
30 |
|
W Valley Yak |
5362 |
28 |
49 |
60 |
54 |
|
Sequim |
2566 |
33 |
50 |
42 |
23 |
|
Bethel |
20583 |
37 |
50 |
35 |
24 |
|
Renton |
14564 |
31 |
51 |
41 |
27 |
|
Sedro Woolley |
4370 |
30 |
52 |
37 |
24 |
|
Ferndale |
4540 |
38 |
52 |
37 |
28 |
|
Cheney |
5288 |
32 |
52 |
39 |
28 |
|
Vancouver |
21606 |
37 |
52 |
40 |
23 |
|
Clarkston |
2459 |
39 |
54 |
32 |
22 |
|
Wenatchee |
7208 |
35 |
54 |
38 |
27 |
|
Franklin Pierce |
7216 |
37 |
55 |
28 |
17 |
|
Marysville |
9832 |
41 |
55 |
28 |
17 |
|
Tacoma |
26779 |
38 |
55 |
30 |
18 |
|
Evergreen |
22864 |
40 |
56 |
38 |
21 |
|
Kent |
25207 |
35 |
56 |
28 |
39 |
|
West Valley Spokane |
3402 |
37 |
57 |
32 |
19 |
|
Auburn |
17317 |
41 |
57 |
35 |
20 |
|
Ephrata |
2667 |
32 |
58 |
51 |
35 |
|
Spokane |
28612 |
29 |
58 |
39 |
29 |
|
Burlington |
3240 |
45 |
59 |
29 |
27 |
|
Kennewick |
18579 |
30 |
59 |
39 |
23 |
|
Quillayutte |
3228 |
48 K12 INC |
61 |
47 |
13 |
|
E. Valley Yak |
3358 |
28 |
61 |
48 |
37 |
|
Port Angeles |
3462 |
31 |
61 |
55 |
35 |
|
Bremerton |
4512 |
39 |
61 |
25 |
11 |
|
Omak |
5870 |
10 |
61 |
24 |
2 |
|
East Valley Spokane |
3451 |
24 |
62 |
34 |
30 |
|
Selah |
3690 |
30 |
63 |
45 |
32 |
|
Kelso |
4981 |
33 |
63 |
33 |
18 |
|
Moses Lake |
8518 |
32 |
63 |
34 |
22 |
|
Clover Park |
11760 |
34 |
63 |
36 |
19 |
|
Shelton |
4345 |
46 |
64 |
32 |
20 |
|
Eastmont |
5879 |
32 |
65 |
37 |
22 |
|
Mount Vernon |
6663 |
36 |
65 |
34 |
21 |
|
Longview |
6176 |
37 |
66 |
43 |
26 |
|
Aberdeen |
3162 |
37 |
67 |
38 |
18 |
|
Walla Walla |
5443 |
34 |
67 |
38 |
26 |
|
Highline |
17580 |
39 |
68 |
29 |
17 |
|
Federal Way |
20713 |
39 |
73 |
29 |
19 |
|
Tukwila |
2512 |
36 |
74 |
25 |
12 |
|
Pasco |
18112 |
36 |
74 |
27 |
19 |
|
Centralia |
3400 |
32 |
76 |
34 |
19 |
|
Prosser |
2395 |
29 |
78 |
34 |
19 |
|
Toppenish |
4307 |
19 |
79 |
18 |
9 |
|
Sunnyside |
6268 |
30 |
80 |
45 |
19 |
|
Quincy |
3121 |
37 |
82 |
33 |
13 |
|
Othello |
4555 |
23 |
82 |
28 |
15 |
|
Yakima |
15316 |
36 |
83 |
30 |
13 |
|
Wapato |
3150 |
43 |
88 |
22 |
12 |
|
Grandview |
3478 |
30 |
88 |
46 |
24 |
To determine the difference between the top 10 school districts by income (green background) and the bottom 10 by income (yellow background), we will total the top 10 school districts for 2019 and 2023 and divide by 10:
2019: 702/10=70.2
2023: 578/10 = 57.8
We will then total the bottom 10 school districts for 2019 and 2023 and divide by 10:
2019: 317/10 = 31.7
2023: 162/10 = 16.2
The 2019 gap was 70.2 minus 31.7 = 38.5% of additional low income students who did not pass the 8th grade math test.
The 2023 gap was 57.8 minus 16.2 = 41.6% of additional low income students who did not pass the 8th grade math test.
Therefore, the Achievement Gap reached a new record in 2023. Washington state was 42nd in the nation in 2019 and 2022. It is likely that Washington state will drop even further in 2023.
What is terrible about this statistic is that Washington state has near highest income in the nation. We ought to be up with Massachusetts and New Jersey in terms of having the lowest Achievement Gap in the nation.
But it would take an actual increase in school funding so we could lower class sizes to the national average. Since that is not likely to happen as long as we are leading the nation in tax breaks for wealthy trillion dollar corporations, we need to find some low cost options to get low income students engaged in school.
Here is a table of our 100 school districts ranked by 2023 8th grade math scores:
|
School District |
Enroll 2022 - 23 |
Chronic Absence CA % |
% Free Lunch |
8th grade math spring |
8th grade math spring |
|
Mercer Is |
3982 |
10 |
5 |
81 |
71 |
|
Issaquah |
19225 |
19 |
12 |
76 |
68 |
|
Lake WA |
30591 |
21 |
10 |
76 |
68 |
|
Bainbridge Is |
3505 |
23 |
9 |
78 |
67 |
|
Camas |
7119 |
18 |
16 |
74 |
63 |
|
Bellevue |
18651 |
15 |
21 |
71 |
60 |
|
W Valley Yak |
5362 |
28 |
49 |
60 |
54 |
|
Pullman |
2687 |
25 |
36 |
57 |
54 |
|
Snoqualmie V |
7010 |
20 |
12 |
69 |
51 |
|
Northshore |
22378 |
20 |
16 |
64 |
50 |
|
Tahoma |
8823 |
22 |
18 |
61 |
50 |
|
Anacortes |
2523 |
24 |
32 |
67 |
49 |
|
Sumner |
10148 |
30 |
29 |
61 |
49 |
|
Seattle |
50336 |
25 |
30 |
61 |
48 |
|
Shoreline |
9142 |
24 |
29 |
63 |
47 |
|
Everett |
19761 |
30 |
39 |
56 |
47 |
|
Peninsula |
8858 |
23 |
21 |
63 |
46 |
|
Snohomish |
9255 |
28 |
21 |
54 |
46 |
|
Riverview |
3060 |
25 |
15 |
60 |
44 |
|
Olympia |
9473 |
24 |
32 |
69 |
43 |
|
Mead |
10218 |
17 |
31 |
64 |
42 |
|
Univ Place |
5511 |
22 |
40 |
64 |
42 |
|
Central Valley |
14119 |
31 |
42 |
51 |
40 |
|
Yelm |
5565 |
29 |
46 |
50 |
40 |
|
North Kitsap |
5295 |
30 |
35 |
49 |
40 |
|
Bellingham |
11316 |
35 |
33 |
46 |
40 |
|
Ridgefield |
3877 |
32 |
25 |
53 |
39 |
|
Kent |
25207 |
35 |
56 |
28 |
39 |
|
Enumclaw |
4253 |
26 |
29 |
58 |
37 |
|
E. Valley Yak |
3358 |
28 |
61 |
48 |
37 |
|
Port Angeles |
3462 |
31 |
61 |
55 |
35 |
|
Tumwater |
6681 |
29 |
33 |
51 |
35 |
|
Ephrata |
2667 |
32 |
58 |
51 |
35 |
|
Lake Stevens |
9353 |
27 |
29 |
51 |
34 |
|
White River |
4211 |
27 |
32 |
46 |
34 |
|
Richland |
13641 |
25 |
41 |
45 |
34 |
|
South Kitsap |
8975 |
30 |
40 |
40 |
34 |
|
Washougal |
2802 |
36 |
38 |
53 |
33 |
|
Monroe |
5494 |
31 |
33 |
50 |
33 |
|
Mukilteo |
15190 |
28 |
48 |
48 |
33 |
|
Battleground |
12155 |
27 |
37 |
46 |
32 |
|
STATE |
1.07M |
30 |
44 |
46 |
32 |
|
Selah |
3690 |
30 |
63 |
45 |
32 |
|
Central Kitsap |
10941 |
28 |
39 |
56 |
31 |
|
Edmonds |
19926 |
29 |
38 |
49 |
31 |
|
Ellensburg |
3203 |
26 |
42 |
48 |
31 |
|
Lynden |
3440 |
19 |
41 |
47 |
31 |
|
Oak Harbor |
5513 |
26 |
41 |
41 |
31 |
|
Stanwood |
4705 |
30 |
30 |
56 |
30 |
|
Chehalis |
2869 |
30 |
49 |
50 |
30 |
|
East Valley Spokane |
3451 |
24 |
62 |
34 |
30 |
|
Spokane |
28612 |
29 |
58 |
39 |
29 |
|
N. Thurston |
14809 |
35 |
44 |
46 |
28 |
|
Cheney |
5288 |
32 |
52 |
39 |
28 |
|
Ferndale |
4540 |
38 |
52 |
37 |
28 |
|
Puyallup |
22869 |
33 |
42 |
46 |
27 |
|
Renton |
14564 |
31 |
51 |
41 |
27 |
|
Wenatchee |
7208 |
35 |
54 |
38 |
27 |
|
Burlington |
3240 |
45 |
59 |
29 |
27 |
|
Longview |
6176 |
37 |
66 |
43 |
26 |
|
Walla Walla |
5443 |
34 |
67 |
38 |
26 |
|
Orting |
2699 |
35 |
31 |
36 |
26 |
|
Arlington |
5420 |
29 |
38 |
37 |
25 |
|
Steilacoom |
3070 |
23 |
28 |
53 |
24 |
|
Grandview |
3478 |
30 |
88 |
46 |
24 |
|
Sedro Woolley |
4370 |
30 |
52 |
37 |
24 |
|
Bethel |
20583 |
37 |
50 |
35 |
24 |
|
Sequim |
2566 |
33 |
50 |
42 |
23 |
|
Vancouver |
21606 |
37 |
52 |
40 |
23 |
|
Kennewick |
18579 |
30 |
59 |
39 |
23 |
|
Fife |
3854 |
27 |
48 |
29 |
23 |
|
Eastmont |
5879 |
32 |
65 |
37 |
22 |
|
Moses Lake |
8518 |
32 |
63 |
34 |
22 |
|
Clarkston |
2459 |
39 |
54 |
32 |
22 |
|
Evergreen |
22864 |
40 |
56 |
38 |
21 |
|
Mount Vernon |
6663 |
36 |
65 |
34 |
21 |
|
Auburn |
17317 |
41 |
57 |
35 |
20 |
|
Shelton |
4345 |
46 |
64 |
32 |
20 |
|
Sunnyside |
6268 |
30 |
80 |
45 |
19 |
|
Clover Park |
11760 |
34 |
63 |
36 |
19 |
|
Prosser |
2395 |
29 |
78 |
34 |
19 |
|
Centralia |
3400 |
32 |
76 |
34 |
19 |
|
W Valley Spokane |
3402 |
37 |
57 |
32 |
19 |
|
Federal Way |
20713 |
39 |
73 |
29 |
19 |
|
Pasco |
18112 |
36 |
74 |
27 |
19 |
|
Aberdeen |
3162 |
37 |
67 |
38 |
18 |
|
Kelso |
4981 |
33 |
63 |
33 |
18 |
|
Tacoma |
26779 |
38 |
55 |
30 |
18 |
|
Lakewood |
2535 |
41 |
44 |
37 |
17 |
|
Highline |
17580 |
39 |
68 |
29 |
17 |
|
Franklin Pierce |
7216 |
37 |
55 |
28 |
17 |
|
Marysville |
9832 |
41 |
55 |
28 |
17 |
|
Othello |
4555 |
23 |
82 |
28 |
15 |
|
Quillayutte |
3228 |
48 K12INC |
61 |
47 |
13 |
|
Quincy |
3121 |
37 |
82 |
33 |
13 |
|
Yakima |
15316 |
36 |
83 |
30 |
13 |
|
Tukwila |
2512 |
36 |
74 |
25 |
12 |
|
Wapato |
3150 |
43 |
88 |
22 |
12 |
|
Bremerton |
4512 |
39 |
61 |
25 |
11 |
|
Toppenish |
4307 |
19 |
79 |
18 |
9 |
|
Omak |
5870 |
10 |
61 |
24 |
2 |
Here is a graph of some of the lowest performing school districts in our state:
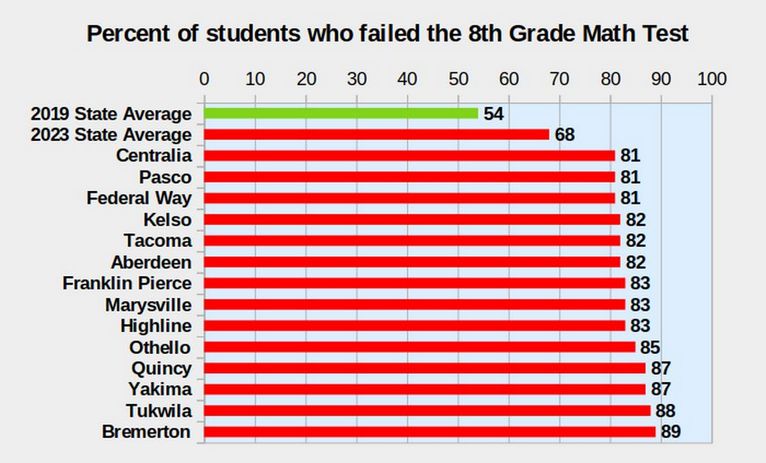
It is stunning how many school districts in Washington state now have fewer than 20% of the students who are able to pass the 8th grade math test. Since Reykdal took office, we now have only a few school districts left that are performing well. Sadly, we now have a huge number of school districts that are doing very poorly. It is shocking that one person can mismanage the schools and cause so much damage in such a short period of time – and yet still have the audacity to claim that our schools are doing well!
Chronic Absenteeism is an underlying cause of very low math scores
The state average chronic absentee rate when Reykdal took office was 15%. It is now up to 30%. Here is the chronic absentee rate among the 20 top scoring school districts: 454/20 = 22.7
Here is the chronic absentee rate among the 20 bottom scoring school districts: 701/20 = 35.1
The bottom performing school districts have huge chronic absentee rates in addition to very high poverty rates.
If we do not have the funds to lower class sizes, at the very least we need to get the students back in class again. A very low cost way to do this is by increasing parent and child involvement in after school sports and after school clubs. Both of these require returning to local control of schools. This in turn requires electing someone else other than Chris Reykdal.
Sadly, if Reykdal is elected for another 4 years, then our low income kids will be forced to struggle through 4 more years of the worst Achievement Gaps in the nation.
As always, I look forward to your questions and comments.
Regards,
David Spring M. Ed.
David Spring at Proton Mail dot com