
At a candidate forum on May 20, 2024, Chris Reykdal’s two opponents for State Superintendent both claimed that Washington students have suffered huge declines on national tests. At the same forum, Chris Reykdal claimed that only two states in the nation were performing better than our students.
Chris Reykdal stated: “Let's talk about Washington state on reading. In fourth grade, there are only six states in the country that are statistically outperforming us. By eighth grade, there are only two states that are statistically outperforming us.”
Adding fuel to the fire, on September 17, 2023, the Seattle Times claimed that Reykdal was a “cheer leader for mediocrity.” https://www.seattletimes.com/opinion/editorials/cheerleading-mediocrity-is-not-good-enough-for-was-education-department/
Here are a couple of quotes from this Seattle Times editorial:
“To call Washington’s most recent education results lackluster would be putting it politely. Just 30% of 10th graders tested last spring were at grade level in math… In 2020-21, one-third of 8th graders were at grade level in math. Two years later, when the same group of students were in 10th grade, only 29.9% met that benchmark.”
“OSPI... appears to be aimed primarily at cheer leading mediocrity.”
In this article, we will review both national test results (the National Assessment of Education Progress or NAEP test) as well as state test scores to assess the performance of Washington state students. We will show that the situation is even worse than the Seattle Times article. Since Chris Reykdal took office in January 2017, Washington students have suffered record learning losses. These learning losses began even before the 2020 school closures.
How to view NAEP test scores for yourself
Here is a link to the NAEP test results page for Washington: https://www.nationsreportcard.gov/profiles/stateprofile/overview/WA?chort=1&sub=MAT&st=MN&year=2022R3&sfj=NP&cti=PgTab_OT&sj=WA
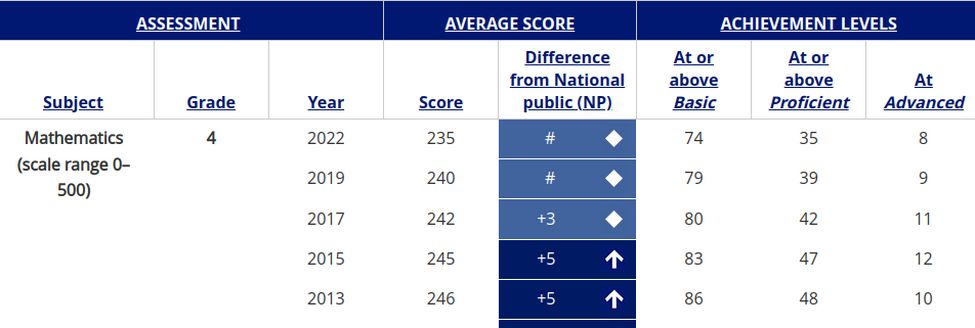
Here is a chart on the 4th Grade Math test. Historically, Washington 4th graders have averaged 5 points above the national average – which was near the top in the nation. In 2019, Washington 4th graders fell to the national average or 25th in the nation. When Reykdal took office, about half of our Fourth graders were proficient in math. Currently on 35% are proficient:
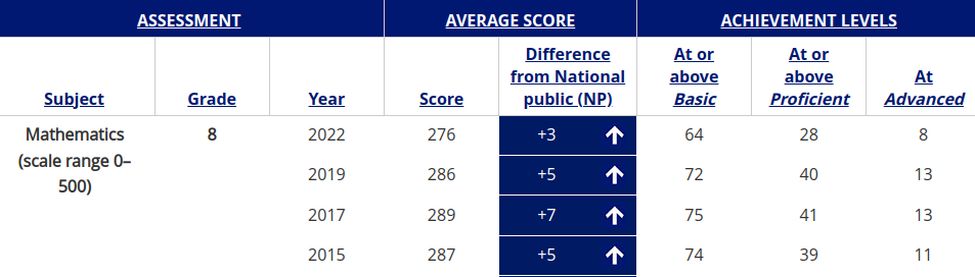
The Eighth Grade Math score is nearly as disastrous. When Reykdal took office, Washington Eighth Graders were among the highest in the nation at 7 points above the national average and with 41% proficient. Currently, our Eighth graders are only 3 points above the national average and only 28% are proficient. Clearly our students are going in the wrong direction on the math tests.
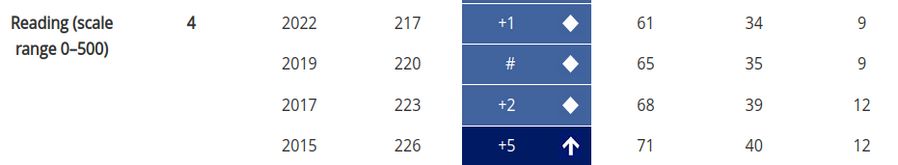
There is a similar result for Fourth Grade reading. Before Reykdal took office, our students were 5 points above the national average with 40% being proficient. By 2019, our students fell to the national average with only 35% proficient. Currently, only 34% are proficient and the average score is only one point above the national average.
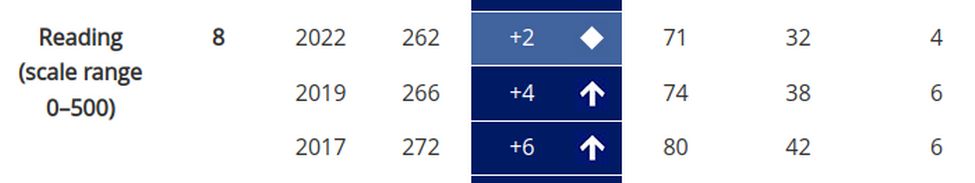
The Eighth Grade reading test is only slightly better. When Reykdal took office, our students were 6 points above the national average with 42% proficient and near the top in the nation. Currently our Eighth Grade students are only 2 points above the national average and the percent of Washington students who are proficient fell from 42% in 2017 to 32% in 2022 - one of the largest declines in reading scores the nation.
The reason Washington state students have historically performed near the highest in the nation is that Washington is one of the eight wealthiest states in the nation. It is therefore shocking that our student test performance has fallen to the national average.
Nevertheless, let’s look at State Comparisons to see how that has changed since Reykdal became our state superintendent. To get to the state comparison page for Washington, go to the above link and click on the State Comparisons tab.
On Fourth Grade Math, Washington is now 27th in the nation. In 2015, Washington was 8th in the nation. On Eighth Grade Math, Washington is now 18th in the nation. In 2015, Washington was 8th in the nation.
On Fourth Grade Reading, Washington is now 24th in the nation. In 2015, Washington was 14th in the nation. On Eighth Grade Reading, in 2017, Washington was 8th in the nation:
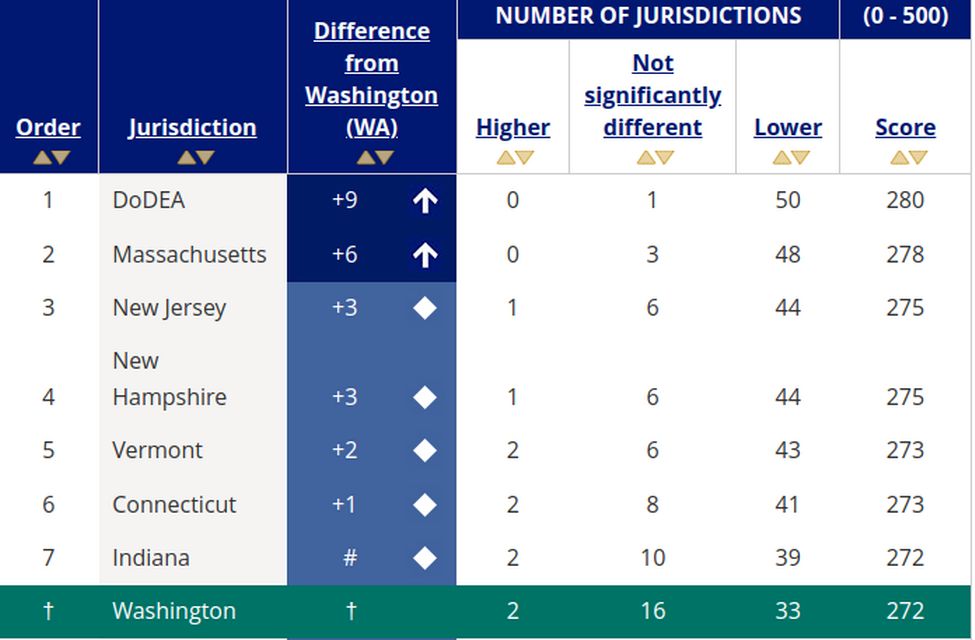
Note that only two “jurisdictions” were higher than Washington state in 2017. One is called DoDEA which stands for the Department of Defense K12 Education which operates 163 schools with 66,000 students and 8,500 teachers. DoDEA has an average of 8 students per teacher.
The average middle school class size is 16 students per teacher which is much less than the US average of about 25 students per teacher. DoDEA has a high school graduation rate of 97% which is much higher than the US average of 80%. It would take at least a 50% increase in school funding for Washington state to reduce our class sizes to the DoDEA average.
In addition, note that Massachusetts and New Jersey students score significantly higher than any other state. These states are ranking second and third of all states in per capita income. Washington is ranked 8th in the nation in per capita income. Washington therefore should be about 8th in the nation in NEAP test scores.
Because of their higher income, Massachusetts spends about $3,000 more per student than Washington state and New Jersey spends about $4,000 per student more than Washington state. Thus, their average class size is about 10% to 20% smaller than Washington state.
Here are the results on the 2022 NAEP 8th Grade Reading test. Washington is now 15th in the nation in 8th Grade Reading:
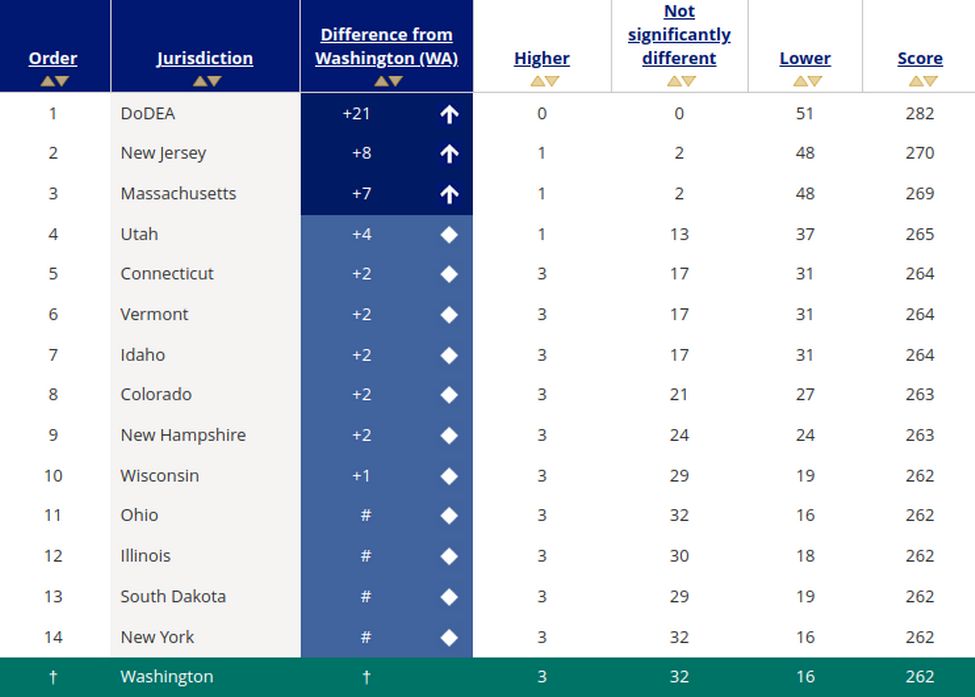
So during the forum on May 20, 2024, Reykdal was boasting about the fact that our students fell from 8th in the nation to 15th in the nation and suffered a record decline of 10 points on the 8th Grade Reading test!
Knowing this, let’s take a closer look at what Reykdal actually said:
“Let's talk about Washington state on reading... By eighth grade, there are only two states that are statistically outperforming us.”
Notice Reykdal’s careful use of the word “statistically.” Reykdal is misleading thousands of TWV viewers by taking advantage of the fact that NAEP test scores have a statistical range of plus or minus 3 points. This means that there is a very small chance that if the test was given 100 times, our students might have gotten a score that was 3 points higher or 3 points lower. While our actual score was 262, there is a one in 20 chance it could have been 263 or 261. There is a one in 100 chance it could have been as high as 265 or as low as 259.
If our students got a score of 265, there would only be two states that outperformed us. These are New Jersey and Massachusetts. But there is also an equal tiny chance that our students would have gotten a score of 259 which would have placed us 30th in the nation!
What is more truthful is that 95% of the time, our 8th Grade students would get a score of 262 and be 15th in the nation in reading – which is a huge drop from 8th in the nation when Reykdal took office and is also a record drop of 10 points in NAEP 8th Grade reading scores.
The Biggest Red Flag is NAEP Math Scores
Far more concerning than the record drop in 8th Grade Reading scores, Washington students suffered a record decline on the 4th and 8th Grade Math tests. The reason this should set off alarm bells is that Washington is one of the ten most affluent states in the nation – and all standardized tests are known to be related to family income – with students from more affluent families performing much better than students from poorer families (also know as the Achievement Gap). Because of this factor, Washington students have always performed in the Top Ten states on the NAEP Math tests. On several occasions, our students have performed in the Top Five states as is shown by this graph:
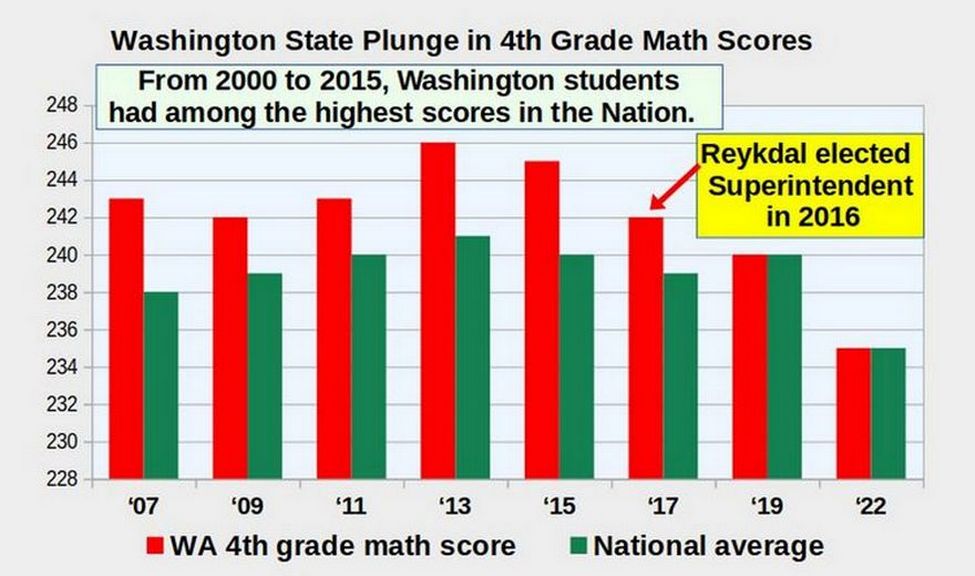
You can see from the above graph that even before 2020, Reykdal’s policies had been a disaster. In fact, since Reykdal was elected, Washington student test scores on the NAEP Fourth Grade Math test have declined more than in any other state in the nation! Since Reykdal took office, Washington students have lost more than a year of math learning! Reykdal is literally the worst Superintendent in the United States and the worst Superintendent in the history of Washington state as is confirmed by the record decline in 4th Grade Math scores.
Record Decline in Students passing the Washington 8th Grade Math Test
The Washington 8th Grade Math test is important for several reasons. First, it can be correlated to the National 8th Grade Math test – making it harder to rig. Second, it is a good predictor of students passing the 10th grade math test. So it is a look into our future. Third, it includes students who have been subjected to Reykdal’s policies during his entire 8 years in office. These students have never known anything other than Reykdal’s policies.
When Reykdal took office, only 46% of students passed the Washington state 8th Grade Math test. In May 2023, only 32% of students passed the 8th Grade Math test. For the first time in State History, 68% failed the test. In many school districts, 80 to 90% of the students failed this test:
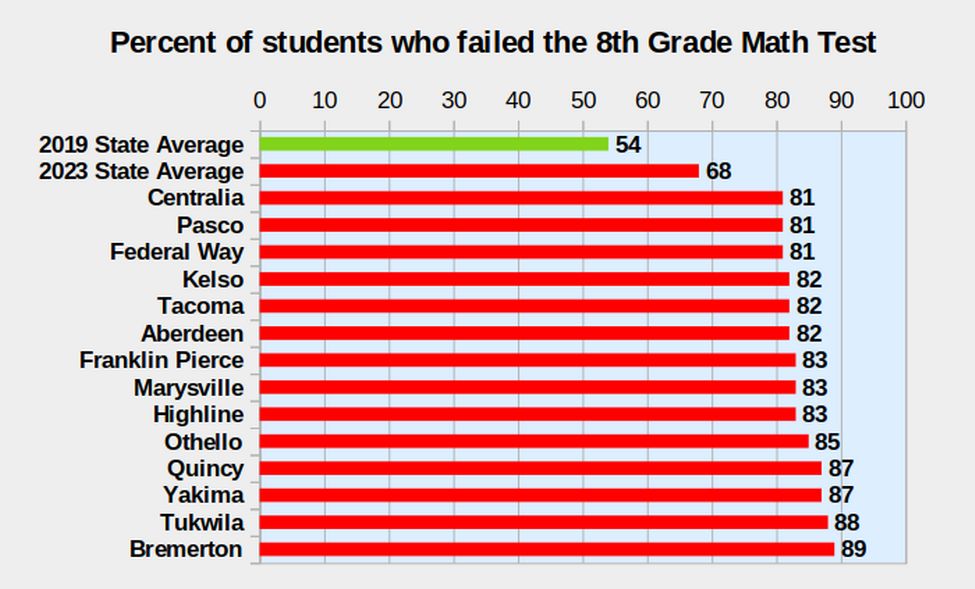
This is an appalling result. After speaking with several 7th and 8th Grade Math teachers about this problem, they claim that very high class sizes make it impossible for them to help struggling students. But in addition, they claimed that there has been a huge increase in Chronic Absenteeism. When students miss math classes, it is very difficult to impossible to help them get caught up.
Chronic Student Absenteeism has doubled since Reykdal took office
The number of students still enrolled in the schools but chronically absent from schools has doubled since Reykdal took office. In 2017, Washington was already near the worst in the nation with 17% chronic absenteeism - likely due to the fact that Washington state has among the highest class sizes in the nation. The average in Washington state rose from 17% in 2017 to 33% in 2022 and 30% in 2023. See: “Chronic Absenteeism: 2017–2023,” American Enterprise Institute, January 2024. https://www.returntolearntracker.net/
Chronic absenteeism is defined as the percentage of students missing at least 10 percent of a school year. In Washington state, this means being enrolled in the public schools but missing at least 18 days of instruction. Chronic absenteeism is strongly related to failing courses and later dropping out of school. It is also strongly related to mental health problems including anxiety, depression, suicidal thoughts, drug abuse and crime rates including the probability of being arrested later in life. Finally, it is strongly related to family poverty and unemployment later in life.
A very large number of these chronically absent students are almost never at school. The ability to recover from school closure learning loss will be severely hampered by current record rates of chronic absenteeism, making it one of the most pressing current problems in public schools. Here are the latest Chronic Absentee rates in selected school districts in Washington:
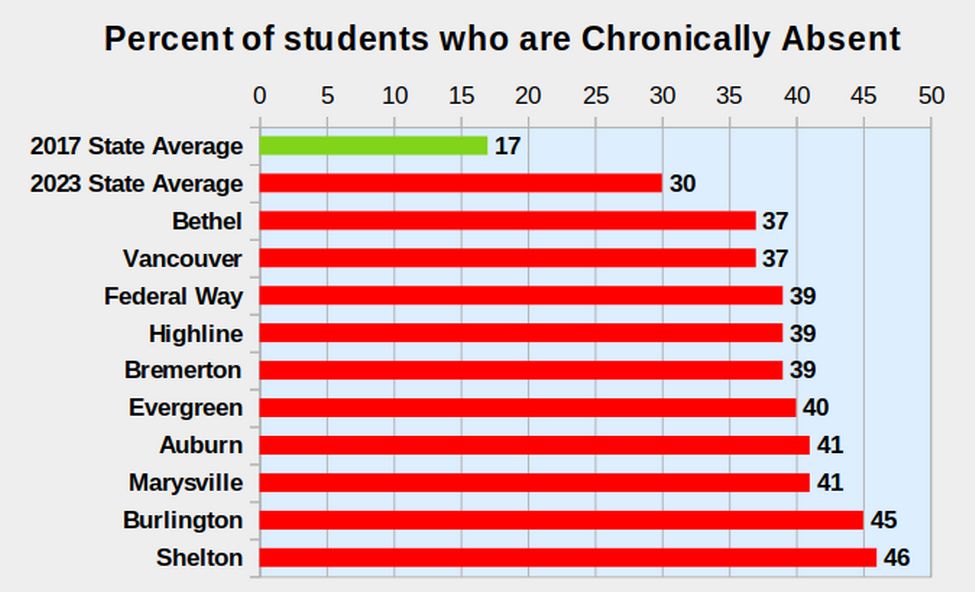
Note that a few school districts in Washington state have done much better than others in encouraging students to attend school. These include the Peninsula School District in Gig Harbor and the Seattle School District. We should take a closer look at these school districts to see how they are able to get parents and students back into the public school system when many other school districts have failed. To be clear, even 17% to 23% student absenteeism is not acceptable. In fact, it represents a serious threat to the current and future well being of our children. However, it is not as bad as school districts with 39 to 41 percent absenteeism. The Marysville school district is already facing bankruptcy and will almost certainly be forced to make huge budget cuts in the coming school year. What are parents, teachers and kids in this school district supposed to do?
Below is a table of 100 school districts in Washington State ranked by student enrollment. The table includes the poverty rate, the increase in the Chronic Absentee Rate and the decline in 8th grade math scores:
|
Enroll rank |
School District |
Enroll |
Chronic Absence % |
% Free Lunch |
8th grade math spring 2019 % passed |
8th grade math spring 2023 % passed |
|
WA |
STATE |
1.07M |
30 |
44 |
46 |
32 |
|
1 |
Seattle |
50336 |
25 |
30 |
61 |
48 |
|
2 |
Lake WA |
30591 |
21 |
10 |
76 |
68 |
|
3 |
Spokane |
28612 |
29 |
58 |
39 |
29 |
|
4 |
Tacoma |
26779 |
38 |
55 |
30 |
18 |
|
5 |
Kent |
25207 |
35 |
56 |
28 |
39 |
|
6 |
Evergreen |
22864 |
40 |
56 |
38 |
21 |
|
7 |
Northshore |
22378 |
20 |
16 |
64 |
50 |
|
8 |
Puyallup |
22869 |
33 |
42 |
46 |
27 |
|
9 |
Vancouver |
21606 |
37 |
52 |
40 |
23 |
|
10 |
Federal Way |
20713 |
39 |
73 |
29 |
19 |
|
11 |
Edmonds |
19926 |
29 |
38 |
49 |
31 |
|
12 |
Bethel |
20583 |
37 |
50 |
35 |
24 |
|
13 |
Everettt |
19761 |
30 |
39 |
56 |
47 |
|
14 |
Bellevue |
18651 |
15 |
21 |
71 |
60 |
|
15 |
Issaquah |
19225 |
19 |
12 |
76 |
68 |
|
16 |
Kennewick |
18579 |
30 |
59 |
39 |
23 |
|
17 |
Highline |
17580 |
39 |
68 |
29 |
17 |
|
18 |
Pasco |
18112 |
36 |
74 |
27 |
19 |
|
19 |
Auburn |
17317 |
41 |
57 |
35 |
20 |
|
20 |
Yakima |
15316 |
36 |
83 |
30 |
13 |
|
21 |
Mukilteo |
15190 |
28 |
48 |
48 |
33 |
|
22 |
Renton |
14564 |
31 |
51 |
41 |
27 |
|
23 |
North Thurston |
14809 |
35 |
44 |
46 |
28 |
|
24 |
Central Valley |
14119 |
31 |
42 |
51 |
40 |
|
25 |
Richland |
13641 |
25 |
41 |
45 |
34 |
|
26 |
Clover Park |
11760 |
34 |
63 |
36 |
19 |
|
27 |
Battleground |
12155 |
27 |
37 |
46 |
32 |
|
28 |
Bellingham |
11316 |
35 |
33 |
46 |
40 |
|
29 |
Central Kitsap |
10941 |
28 |
39 |
56 |
31 |
|
30 |
Mead |
10218 |
17 |
31 |
64 |
42 |
|
31 |
Marysville |
9832 |
41 |
55 |
28 |
17 |
|
32 |
South Kitsap |
8975 |
30 |
40 |
40 |
34 |
|
33 |
Sumner |
10148 |
30 |
29 |
61 |
49 |
|
34 |
Olympia |
9473 |
24 |
32 |
69 |
43 |
|
35 |
Shoreline |
9142 |
24 |
29 |
63 |
47 |
|
36 |
Snohomish |
9255 |
28 |
21 |
54 |
46 |
|
37 |
Lake Stevens |
9353 |
27 |
29 |
51 |
34 |
|
38 |
Tahoma |
8823 |
22 |
18 |
61 |
50 |
|
39 |
Peninsula |
8858 |
23 |
21 |
63 |
46 |
|
40 |
Moses Lake |
8518 |
32 |
63 |
34 |
22 |
|
41 |
Omak |
5870 |
10 |
61 |
24 |
2 |
|
42 |
Franklin Pierce |
7216 |
37 |
55 |
28 |
17 |
|
43 |
Wenatchee |
7208 |
35 |
54 |
38 |
27 |
|
44 |
Camas |
7119 |
18 |
16 |
74 |
63 |
|
45 |
Snoqualmie Valley |
7010 |
20 |
12 |
69 |
51 |
|
46 |
Sunnyside |
6268 |
30 |
80 |
45 |
19 |
|
47 |
Mount Vernon |
6663 |
36 |
65 |
34 |
21 |
|
48 |
Tumwater |
6681 |
29 |
33 |
51 |
35 |
|
49 |
Longview |
6176 |
37 |
66 |
43 |
26 |
|
50 |
Monroe |
5494 |
31 |
33 |
50 |
33 |
|
51 |
Eastmont |
5879 |
32 |
65 |
37 |
22 |
|
52 |
Oak Harbor |
5513 |
26 |
41 |
41 |
31 |
|
53 |
Walla Walla |
5443 |
34 |
67 |
38 |
26 |
|
54 |
Univ Place |
5511 |
22 |
40 |
64 |
42 |
|
55 |
Yelm |
5565 |
29 |
46 |
50 |
40 |
|
56 |
Arlington |
5420 |
29 |
38 |
37 |
25 |
|
57 |
North Kitsap |
5295 |
30 |
35 |
49 |
40 |
|
58 |
W Valley Yak |
5362 |
28 |
49 |
60 |
54 |
|
59 |
Cheney |
5288 |
32 |
52 |
39 |
28 |
|
60 |
Kelso |
4981 |
33 |
63 |
33 |
18 |
|
61 |
Bremerton |
4512 |
39 |
61 |
25 |
11 |
|
62 |
Toppenish |
4307 |
19 |
79 |
18 |
9 |
|
63 |
Othello |
4555 |
23 |
82 |
28 |
15 |
|
64 |
Stanwood Camano |
4705 |
30 |
30 |
56 |
30 |
|
65 |
Shelton |
4345 |
46 |
64 |
32 |
20 |
|
66 |
Ferndale |
4540 |
38 |
52 |
37 |
28 |
|
67 |
Sedro Woolley |
4370 |
30 |
52 |
37 |
24 |
|
68 |
Mercer Is |
3982 |
10 |
5 |
81 |
71 |
|
69 |
Enumclaw |
4253 |
26 |
29 |
58 |
37 |
|
70 |
White River |
4211 |
27 |
32 |
46 |
34 |
|
71 |
Fife |
3854 |
27 |
48 |
29 |
23 |
|
72 |
Selah |
3690 |
30 |
63 |
45 |
32 |
|
73 |
East Valley Spokane |
3451 |
24 |
62 |
34 |
30 |
|
74 |
Grandview |
3478 |
30 |
88 |
46 |
24 |
|
75 |
Bainbridge Is |
3505 |
23 |
9 |
78 |
67 |
|
76 |
Quillayutte |
3228 |
8 K12 INC |
61 |
47 |
13 |
|
77 |
Port Angeles |
3462 |
31 |
61 |
55 |
35 |
|
78 |
West Valley Spokane |
3402 |
37 |
57 |
32 |
19 |
|
79 |
Centralia |
3400 |
32 |
76 |
34 |
19 |
|
80 |
Burlington |
3240 |
45 |
59 |
29 |
27 |
|
81 |
Ridgefield |
3877 |
32 |
25 |
53 |
39 |
|
82 |
Lynden |
3440 |
19 |
41 |
47 |
31 |
|
83 |
Wapato |
3150 |
43 |
88 |
22 |
12 |
|
84 |
E. Valley Yak |
3358 |
28 |
61 |
48 |
37 |
|
85 |
Aberdeen |
3162 |
37 |
67 |
38 |
18 |
|
86 |
Ellensburg |
3203 |
26 |
42 |
48 |
31 |
|
87 |
Quincy |
3121 |
37 |
82 |
33 |
13 |
|
88 |
Riverview |
3060 |
25 |
15 |
60 |
44 |
|
89 |
Steilacoom |
3070 |
23 |
28 |
53 |
24 |
|
90 |
Chehalis |
2869 |
30 |
49 |
50 |
30 |
|
91 |
Washougal |
2802 |
36 |
38 |
53 |
33 |
|
92 |
Tukwila |
2512 |
36 |
74 |
25 |
12 |
|
93 |
Pullman |
2687 |
25 |
36 |
57 |
54 |
|
94 |
Ephrata |
2667 |
32 |
58 |
51 |
35 |
|
95 |
Orting |
2699 |
35 |
31 |
36 |
26 |
|
96 |
Prosser |
2395 |
29 |
78 |
34 |
19 |
|
97 |
Clarkston |
2459 |
39 |
54 |
32 |
22 |
|
98 |
Anacortes |
2523 |
24 |
32 |
67 |
49 |
|
99 |
Sequim |
2566 |
33 |
50 |
42 |
23 |
|
100 |
Lakewood |
2535 |
41 |
44 |
37 |
17 |
Research on bringing parents and students back to public schools
Research indicates that listening to parents and working with parents and encouraging parental involvement is a major key. Instead, Reykdal has been engaged in a war against parents and local school districts – particularly by threatening school districts with loss of funding if they work with parents. Punishing parents and threatening school districts is the wrong approach. Instead, we need to listen to parents and encourage more parental involvement in schools. When kids and families feel school is physically, emotionally healthy and safe, then they feel a sense of belonging. When students have better connections with other students, and feel that the entire community is committed to their school and their future, they will feel welcome and will willingly become academically engaged and will actually want to attend school. Positive parental involvement is the cure for chronic absenteeism.
Conclusion: Washington Students have suffered record learning losses since Reykdal took office
Reykdal’s claim that our students are doing well is simply not accurate. Both National and State test results show exactly the opposite. Under the eight years since Reykdal took, our students have suffered record learning losses. These learning losses started occurring before Reykdal closed all of our schools. And these learning losses have continued to occur even after our schools were re-opened.
Because of the disaster occurring in our schools, a record number of parents (mostly wealthy) have pulled their kids out of our public schools since Reykdal took office. And the poor and middle class kids currently in our schools are suffering from a record rate of chronic absenteeism – which in turn has led to a record drop in 8th grade math test scores.
In a separate report, we will review the record increase in the achievement gap – showing that the gap between poor kids and rich kids has widened dramatically under Reykdal. But the truth is that all of our kids have suffered under Reykdal. It is time for a change. We need a superintendent who will return to local control of our schools which in turn will lead to greater parent involvement and greater student engagement. As always, I look forward to your questions and comments.
Regards,
David Spring M. Ed.
David Spring at Proton Mail dot com